The Carolina coast is constantly changing, and I mean that literally. The inlets shift, the sandbars move, and the water quality can flip from ideal to questionable in a matter of hours. Whether you’re fishing the Cape Fear estuary, launching a kayak near Charleston, or just hitting the beach at Wrightsville, the data collected by coastal monitoring systems is quietly shaping the experience you have out there. It’s one of those things you never think about until you start digging into it, but once you do, it’s actually fascinating stuff.
This is the kind of topic that fits right into what I love doing here in the Environmental Data section: taking the science that runs in the background of our outdoor world and making it make sense for regular people who just want to enjoy the water. So let’s get into it. How does coastal water monitoring actually work, what are scientists measuring, and why should you care?
I actually took my Glide paddleboard out to Davis Creek near Oak Island, NC recently and filmed the whole thing. It’s a beautiful little coastal creek with dark water that looks like sweet tea (totally normal for these tanic blackwater systems), oyster beds everywhere, crabs skittering around, and fish jumping left and right. It’s exactly the kind of hidden coastal gem that this monitoring science is working to protect. Check it out below before we dive in.
That creek is shallow, tanic, and full of oyster beds and wildlife. It’s exactly the kind of coastal environment that benefits from consistent water quality monitoring. The data doesn’t just serve scientists. It serves anyone who wants to be out there.
Why Coastal Monitoring Matters
Coastal zones are some of the most dynamic environments in the world. Think about what’s happening at any given moment along the NC or SC coastline: river discharge from inland watersheds, tidal cycles pushing and pulling, storm systems rolling through, seasonal temperature swings, and constant pressure from recreation and development. There’s a lot going on.
In the Carolinas specifically, major river systems like the Cape Fear, the Neuse, and the Pee Dee are constantly feeding freshwater and nutrients into coastal estuaries. Those estuaries? They’re the nurseries for most of the fish species that anglers are chasing. When conditions shift in those systems, the effects ripple through the entire food chain fast.
Consistent monitoring helps scientists and resource managers stay ahead of those changes. Without it, a lot of problems wouldn’t be caught until they become visible. Think fish kills, beach closures, or degraded shellfish beds. Nobody wants to show up for a weekend on the coast and find it closed. The monitoring is what prevents that from being a surprise.
Here’s what they’re watching for:
- Harmful algal blooms
- Bacteria levels near public beaches
- Oxygen levels that affect fish survival
- Long-term warming trends
- Storm-related runoff and pollution
Speaking of pollution and what ends up in our waterways — I did a deep dive into EPA Toxic Release Inventory data a while back that really opened my eyes to what’s legally released into Carolina waters. If you haven’t read that one yet, it’s worth your time: Legally Released Water Pollution – A Look at EPA TRI Data.
The Core Measurements Scientists Track
No single number tells you the full story of a coastal ecosystem. That’s what makes this data work so interesting. Researchers are combining multiple measurements over time to build a real picture of what’s happening. Here are the key ones.
Water Temperature
Temperature drives a lot of behavior along the Carolina coast: fish migration, breeding cycles, feeding patterns. Slight long-term increases can quietly alter habitats. It’s one of the simplest measurements but also one of the most telling when you look at the trends over time.
Salinity
Salinity is the measure of how much salt is dissolved in the water. In estuaries where freshwater and saltwater mix, salinity levels can shift dramatically day to day. Storms, droughts, heavy rainfall, all of it affects salinity, which in turn affects spawning grounds and shellfish beds. That dark, tanic water I was paddling through at Davis Creek? That’s a perfect example of a brackish transition zone where salinity levels are constantly in flux.
Dissolved Oxygen
Marine life needs oxygen dissolved in the water to survive, same concept as us breathing air. When oxygen levels drop (often triggered by nutrient runoff or algae growth), fish and invertebrates start struggling fast. Continuous oxygen monitoring gives early warning before a problem becomes a disaster.
Turbidity
Turbidity is just water clarity. After a major storm rolls through the Carolina coast, sediment clouds the water, blocks sunlight from reaching submerged plant life, and disrupts the whole system below the surface. The oyster beds I was navigating around at Davis Creek actually help filter turbidity naturally, which is another reason those beds matter so much.
Nutrients and Bacteria
Heavy rainfall carries fertilizers, waste, and other pollutants from the land into rivers and eventually coastal waters. Tracking bacteria and nutrient levels is what drives public health advisories — beach closures, shellfish harvesting bans, swimming warnings. This is the data that directly affects your weekend plans.
The Technology Powering Coastal Data Collection
Collecting reliable data in saltwater is genuinely hard. Salt corrodes, waves create constant movement, and storms put everything under stress. The equipment has to be built to survive conditions that would destroy ordinary electronics in short order. Here’s how the major systems work.
Fixed Monitoring Stations
These are mounted on docks, pilings, or research platforms and run continuously — transmitting data via cellular or satellite to research facilities. Some of these stations have been running for decades, which is what makes the long-term trend analysis possible. That multi-decade dataset is genuinely irreplaceable.
Offshore Buoys
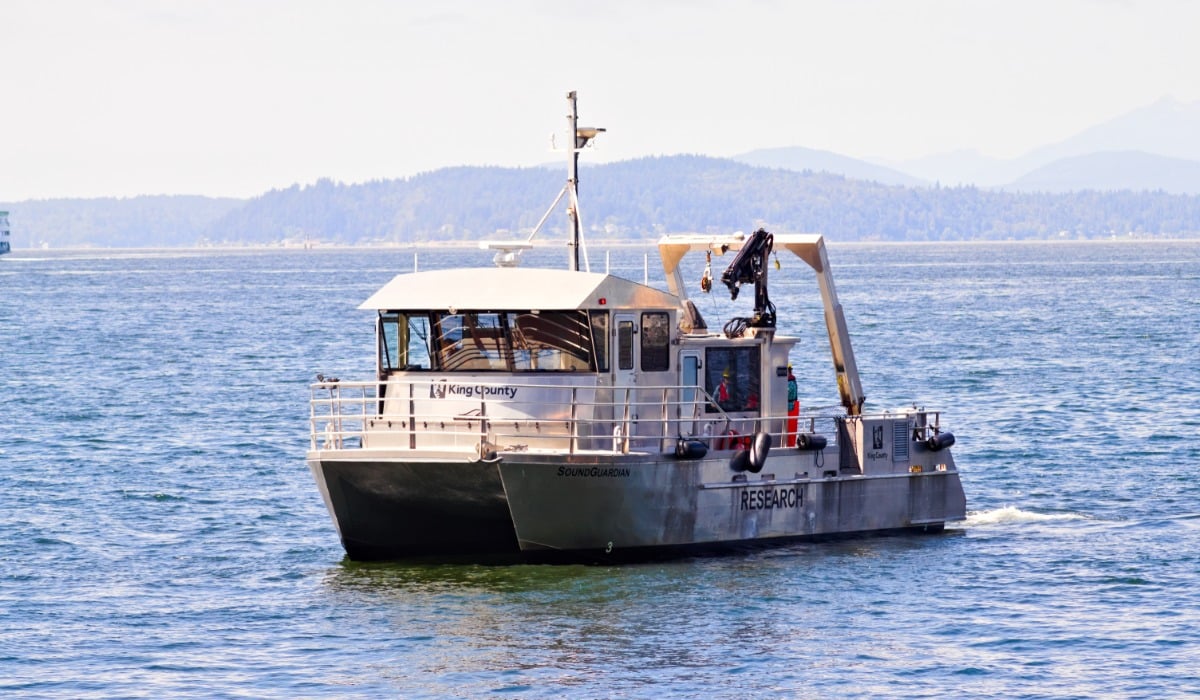
Buoys float miles offshore collecting not just water data but also wave height, wind speed, and air temperature. If you’ve ever pulled up NOAA buoy data before heading out on the water, this is where that information comes from. I always check buoy readings before any coastal boat trip — it’s some of the most useful real-time data available to recreational boaters.
Speaking of boat trips — if you’re thinking about getting on the water along the coast, I’ve got a solid post on 6 Things To Consider When Buying a Fishing Boat that’s worth a read before you commit to anything.
Autonomous Underwater Vehicles (AUVs)
AUVs are robotic systems that travel pre-programmed routes underwater, collecting data across wide areas without needing a crew on the water for every survey. They cover territory that would otherwise require massive amounts of boat time and manpower, and they don’t take breaks.
Protecting the Electronics That Make It All Work
Note: The following section contains an external link to Rimnetics, a third-party contributor. Just Chillin Outdoors has no affiliation with this organization.
Here’s something I find genuinely interesting from an engineering standpoint: the sensors and electronics inside all these monitoring systems are highly sensitive instruments. Saltwater, pressure changes, biological growth, all of it works against them constantly. The housings that protect that gear are actually a serious piece of the puzzle.
A lot of scientific instrument manufacturers use specialized enclosure techniques to keep the internal circuitry protected in harsh marine environments. One method worth knowing about is reaction injection molding — a process that creates durable, corrosion-resistant housings for sensitive equipment. You can learn more about how laboratory and scientific equipment manufacturers use RIM encapsulation to solve exactly this kind of problem. Without protective housings built for saltwater conditions, a lot of these ocean-based monitoring systems would fail well before their time.
How This Data Shapes Your Time on the Water
This is where it gets personal. All of this monitoring infrastructure isn’t just for scientists writing research papers. It directly affects the quality of what you experience when you head to the coast.
Safer Boating
Wave height, current speed, storm-related conditions: that buoy data updates constantly and it can be the difference between a great day on the water and a dangerous one. The Carolina coastline near the inlets is notorious for shifting sandbars. The monitoring data helps boaters make informed decisions instead of guessing.
Better Fishing
Temperature and salinity readings directly inform where fish are likely to be concentrated at any given time. Fisheries managers use this data to understand seasonal movements and set appropriate regulations. If you’ve ever noticed that the bite seems tied to water temperature more than anything else, you’re already thinking like a data scientist.
Public Health Protection
After heavy rainfall, bacteria levels near beaches can spike fast. Monitoring is what allows local authorities to issue advisories quickly and lift them just as quickly once conditions improve. It’s a system that’s working in the background every time you’re at the beach.
Storm Recovery
After a hurricane hits the Carolinas, rapid water quality testing is what determines when waterways are safe again for recreation. That data-driven recovery process gets people back on the water faster and more safely than guessing ever could.
Long-Term Trends and Why They Matter
One of the most powerful things about modern coastal monitoring programs is the long-term dataset they’re building. Decades of consistent measurements allow scientists to see patterns that are completely invisible in any single reading. That’s the kind of longitudinal data work that genuinely excites me.
Long-term datasets can reveal gradual warming trends, shifts in salinity tied to changing rainfall patterns, increased nutrient runoff linked to land development, and habitat degradation in specific estuaries. For conservationists and policymakers, that information drives real decisions. For outdoor enthusiasts, it’s what helps preserve the fisheries, beaches, and waterways that make the Carolina coast worth visiting.
If you’re interested in the data side of what’s happening in Carolina waterways, my Environmental Data Projects section is where I dig into this kind of thing. I’ve already covered EPA water pollution data in depth and there’s more coming.
The Waters Are Worth Protecting
That Davis Creek paddle near Oak Island stuck with me. The water was dark, shallow, and full of life. Oyster beds just under the surface, fish breaking water every few minutes, crabs working along the edges. It looked wild and untouched. And it is, to a degree. But it’s also part of a coastal system that’s being actively monitored and managed to keep it that way.
The science behind coastal water monitoring isn’t academic. It’s practical, ongoing, and directly connected to every trip you take to the coast. The next time conditions look good for casting a line or launching a kayak, there’s a whole network of sensors, buoys, and research stations running in the background making sure that’s actually true.
If you’re looking to get out on the water in the Carolinas, here are a few resources from JCO that’ll help you plan it right:
- A Guide to Kayaking the North Carolina Piedmont (my go-to resource for NC paddling spots)
- Finding the Right Dry Bag for Kayaking (protect your gear on the water)
- Places to Enjoy the Water (my top spots across the Carolinas and beyond)
- The 12 Foot Jon Boat to Rule the Lake (if you’re building out a boat setup)