This post is a follow-up to the original Violent Crime in Charlotte, NC post. It is recommended you check that out first for context and important disclaimers.
As I built out my original dashboard focused on Charlotte’s violent crime, one key piece of information I got feedback on was the lack of a per capita look. The area has been growing rapidly if you know anything about Charlotte and the surrounding Mecklenburg County. This is visible with the new construction. But, the primary driver is population growth. Charlotte has become a hub for financial companies, attracting talent and building an economy here.
Given this, creating a way to see violent crime per capita would be fair. So, I decided to take a new look at the data. To do this, I took the Mecklenburg County population per year for 2017 to 2023. This was derived from the Census’s ACS 1-year data. The exception is 2020 where I had to use the ACS 5-year data. I brought this into Tableau and broke violent crime into incidents per 1,000 people in Mecklenburg County.
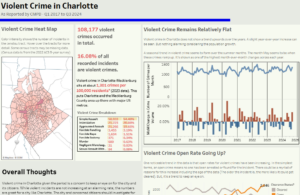
Here is the dashboard I built in Tableau Public. Click the image to access the dashboard.
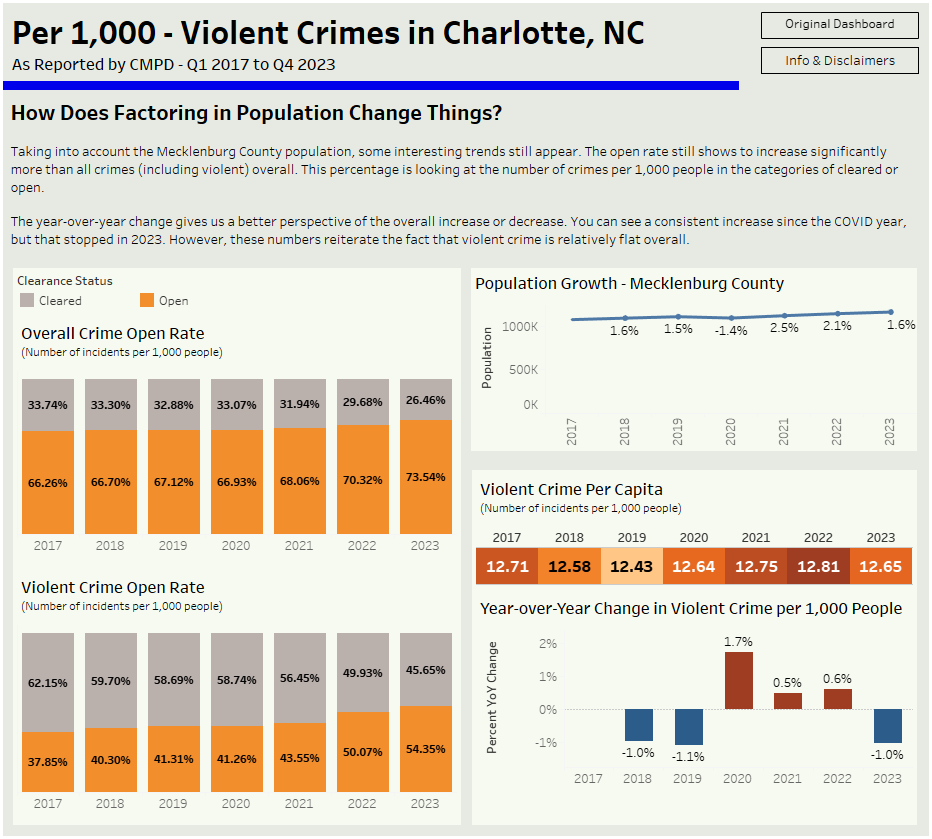
Below, I’ll go into detail on the key areas I focused on in the previous dashboard where a per capita look is beneficial.
Mecklenburg County Population
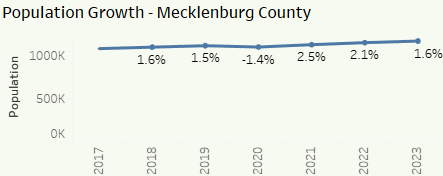
The county population shows a consistent 1-2% increase from 2017 to 2023. The exception being 2020 with a 1.4% decrease. I will note that I pulled this from the ACS 5-year data since 1-year wasn’t available. Most likely due to the lockdowns, it was impossible for the Census Bureau to gather complete data for an ACS 1-year table. A population decline could be possible with people moving home, but I’m not certain about the 2020 figure. Regardless, Mecklenburg County has substantial population growth overall.
NIBRS (National Incident-based Reporting System) Status
In my previous dashboard, I showed the number of violent crimes with an open NIBRS status and those with a cleared NIBRS status. While I called this the open rate, it was purely showing the number of crimes. In this new view, I look at open and cleared crimes as a percentage of a whole for violent incidents per 1,000 people. This shows a real rate and takes into account the population growth. Additionally, I show all criminal incidents to work as a baseline.
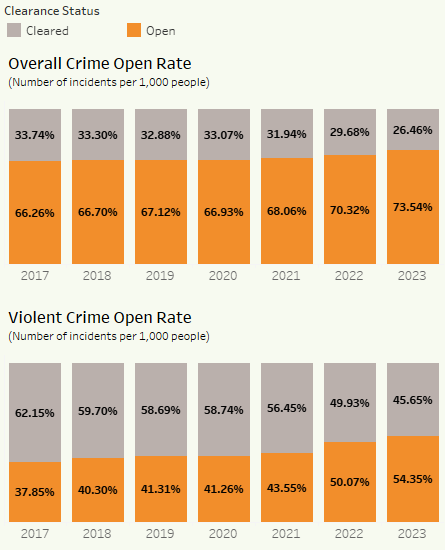
We can still see a noticeable increase in violent crimes per 1,000 people open from 2021 to 2023. An over 10% increase. While the overall crimes per 1,000 people show an increase. It is less than 10% for the entire period being looked at. This helps to affirm that the increase in open crimes is somewhat alarming. But they are solved at better rates overall compared to all criminal activity, whether violent or not.
Is Violent Crime Still Flat?
Another claim I made on the original dashboard was that violent crimes are relatively flat. I am happy to claim this is still true when taking the population into account.
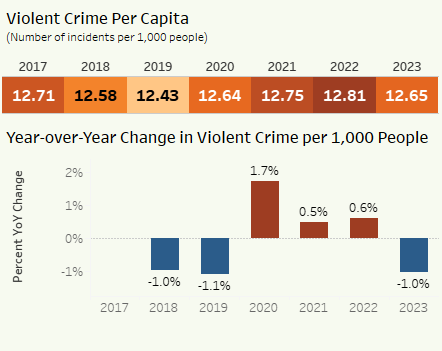
The most dramatic increase shows itself in 2020 at 1.7% over 2019. The overhaul to life that 2020 brought could certainly be the factor at play. Small increases can be seen in the years following. But, in 2023, we have a great-to-see 1% decrease. Overall, this reaffirms that violent crime isn’t on a scary rise like the news cycle makes it seem.
In Conclusion
Given the look at the population, I believe there is still a case to make that the open rate of violent crimes is concerning. Again, it could be due to simple factors like the age of the crime, but it just does not seem normal. While I’m happy that violent crime is flat overall, issues like unsolved crimes threaten this. I’m not going to make a specific recommendation for you or the City of Charlotte here. I do not feel qualified enough to say that. But, I hope to raise attention to the issue so citizens can be informed and ask their leaders to investigate and take action as needed.


Leave a Reply